
Employment number worse than feared in July
Chief Economist Eugenio J. Alemán discusses current economic conditions.
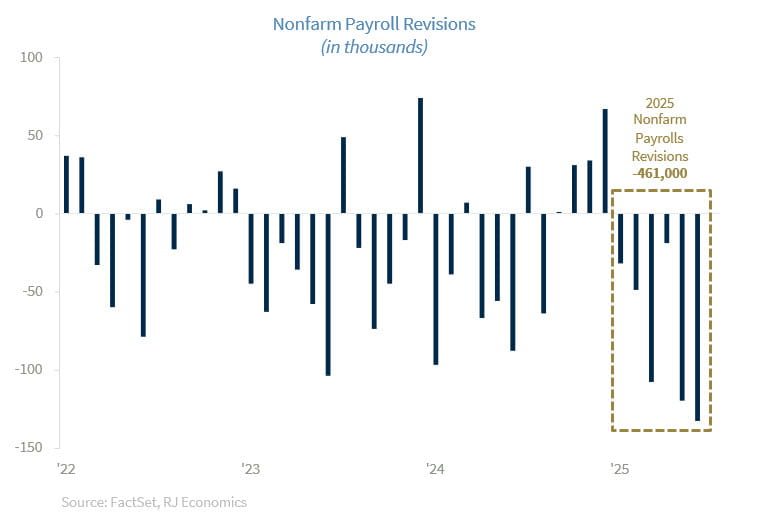
July’s nonfarm employment number was much weaker than expected, up just 73,000, while the downward revisions to the previous two months were larger than 100,000 each of the months. This has the potential to bring July’s positive employment reading into negative territory once the August report comes out early next month. This is not a guarantee—nothing prevents the revision to July’s number from being positive, but year to date, the BLS has revised 2025 employment numbers by -461,000, which is not a great harbinger for what may be in store for the Federal Reserve (Fed) and markets going forward.
Now, the job of the Fed will become even more difficult. It should have reduced interest rates during the first half of the year, and even after the July meeting, as the disinflationary process remained in place and be open to increase rates in the second half, as needed, if the expected price increases from tariffs becomes a long-lasting issue. However, today, the Fed is behind the curve once again and facing a weakening labor market, a weakening economy, and potentially higher prices from the increase in tariffs.
Of course, some may argue that some members of the FOMC may be thinking that the US economy may need a recession to keep inflation contained. However, that goes against their mandate of low and stable prices and high employment. Today, the low and stable price mandate has been achieved but the high employment mandate is starting to falter.
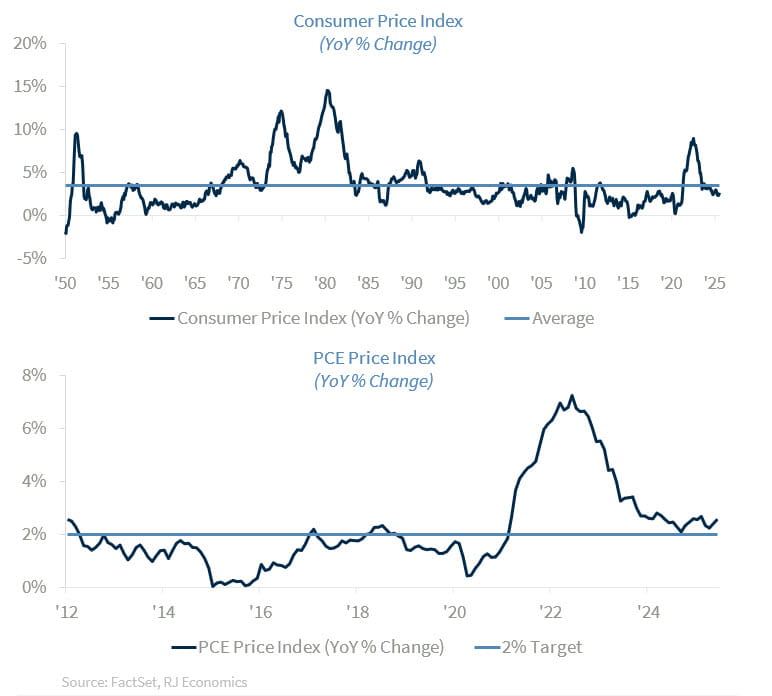
We know we will get some criticism from holding this view but the Fed’s inflation target of 2.0% is a long- term target, i.e., is the direction they want inflation to go, not an immediate target. Even if they don’t achieve the target in the short term, especially for particular reasons, like today’s expected increase in prices due to tariffs, today’s inflation environment is within the Fed’s long-term target. This is especially true considering that the average annual inflation rate since 1948 has been at 3.5% and we are, today, at 2.7% (and 2.6% for the PCE price index), well below that the annual average.
In fact, Fed members should realize that what happened from almost the entire period before the pandemic, from about 2010 and until 2020 was just the opposite to what is happening today. Back then they implemented many programs, like QE, to bring inflation back to the target of 2.0% but were highly unsuccessful. But being unsuccessful is not what is important—what is important with inflation targeting is that you are doing what it takes to bring inflation to the target, even if it takes longer than what you had expected. Today, the correct approach is the same but opposite. You continue to indicate the direction but not fret if you don’t get there immediately. This is what inflation targeting means. This inflation targeting mechanism did not exist back in the 60s, 70s, and early 80s so no, today is not the same as back then for those that disagree with us on that basis (see the section below).
The stagflation obsession keeps going and going
With so much to write about this week we feel like talking about this topic may be an overkill. However, this issue of “stagflation” should have been buried a long time ago but keeps up resurfacing every week. And while we can partially blame the media, my economist colleagues and analysts are also to blame. We have been part of this profession for many decades and understand that catchy phrases and catchy words are our allies in making it into the print, TV, and social media delivery channels.
However, catchy phrases and words should be used carefully and need to be in line with the message we need to send. We should not be using a catchy word just to get attention but then not coming through with a follow up on what that word or phrase means, as it creates more confusion and does not help with the analysis.
In some instances, it may be also a combination of lack of knowledge mixed with some insularity or an editorial trying to call attention with the catchy phrased/word used. We remember at some point back in the day an analyst/economist arguing that the US went into hyperinflation during the 70s and 80s.
Of course, it may seem understandable to think that a rate of inflation of almost 14% in 1980 could be construed as “hyperinflation” in a country that has experienced an annual average rate of inflation of 3.8% during the period 1961-2024 (or just 3.5% during the period going back to 1948). However, that was not hyperinflation. Hyperinflation was Argentina’s rate of inflation in 1989, at 4,923.00%. It is a definitional issue.
Today, we have a similar issue with the resurfacing and usage of the word “stagflation.” Even colleagues who should know better use this word even though we have not seen “stagflation” since the late 70s and early 80s. We are not saying that “stagflation” it is not possible in the future but before talking about “stagflation,” people need to go back and look at the definition of the term and see if it makes sense using it in this context.
The word stagflation is composed of two words: first, stagnation, which occurs when an economy grows below its potential output rate, that is, the rate at which it could grow when it uses all its resources at its fullest ability; and second, inflation, which is the average rate at which overall prices are increasing. That is, stagflation occurs when an economy is growing below potential for several years but at the same time it has a high rate of inflation.
How high should the rate of inflation be? That is not clear. However, the fact that growth below potential tends to be related to low rates of inflation means that, if the rate of inflation is high but growth remains underwhelming, that is, below potential, then the economy has problems and thus we may call that environment a stagflation environment.
One way to approximate the problem or to show a proxy into a potentially stagflationary environment is to look at the Misery Index, which is the summation of the rate of unemployment and the rate of inflation. A high rate of unemployment means the economy is growing below potential. Typically, if the Misery Index is very high, then it tends to show that the economy may be in a stagflation environment.
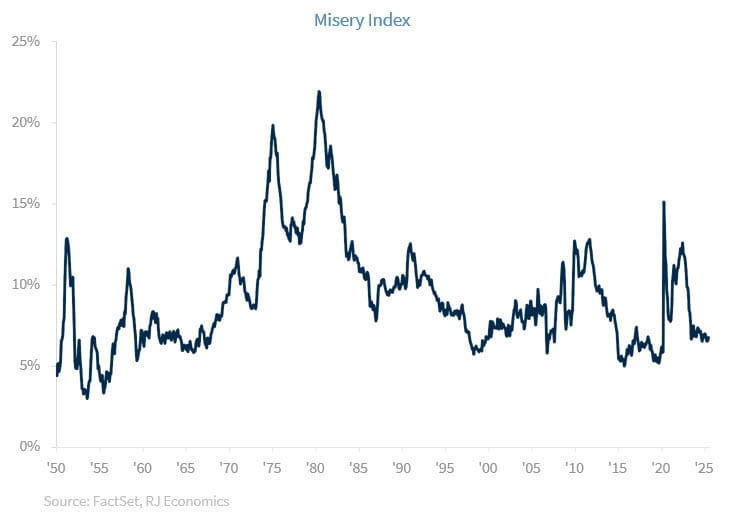
However, we have not seen such an environment since the 1970s and 1980s. The high inflation episode after the COVID-19 pandemic was characterized by very strong economic growth, that is, growth above potential, so the high inflation period was missing the “stagnation” half of the term.
Economic Releases:
FHFA House Price Index: Home prices were down for the second consecutive month, month-on-month, in May, after recording no change in March of this year. This was the lowest year-over-year increase in the HPI (House Price Index), up 2.8%, since April of 2012, as housing prices were starting to recover from the Great Recession. The weakness in home prices, which we expect to continue during the rest of the year points to a sector that is struggling under high mortgage rates. However, the still low inventory of homes is preventing a larger correction in home prices. The Federal Housing Finance Agency (FHFA) House Price Index (HPI) declined by 0.2% during the month of May, month-on-month, while prices remained up by 2.8% on a year-earlier basis, according to the agency. There was an upward revision to April’s month-on- month decline in the FHFA HPI, which had been reported at -0.4% and was revised up to a decline of 0.3%.Five regions of the country showed a decline in the HPI during the month of May, the Pacific region (- 0.6%), the East-North Central (-0.2%), the East-South Central (-0.6%), the Middle Atlantic (-0.8%), and the South Atlantic (-0.1%). Four regions showed an increase in the HPI, with the Mountain region (0.1%), the West-North Central (0.2%), the West-South Central (0.3%), and the New England region, (0.3%). Every region in the country showed a year-over-year increase in the HPI, with the highest region being the Middle Atlantic region, up 5.9%, while the Pacific region showed the smallest increase, at 0.6%. This was the second consecutive month-on-month decline in the HPI after a flat month in March of this year, according to the release.
JOLTS: Although job openings came down in June and were in line with expectations, openings have remained relatively stable, close to June’s rate since early 2024. Furthermore, although total jobs openings were lower in June, most sectors showed an increase in openings. The largest downward surprise in job openings was a large decline in the health care and social assistance sector as well as a large decline in leisure and hospitality job openings, with job openings in accommodation and food services accounting for the largest share. One of the largest increase in job openings during the month of June was in the retail trade sector. The job openings number supports our view that the US labor market continues to weaken. Job openings were 7.4 million in June, down from 7.7 million in May, according to the Bureau of Labor Statistics. The largest decline in job openings was in the all-important health care and social assistance sectors. Job openings declined in that sector from 1.615 in May to 1.371 million in June. There was also a relatively large decline in the leisure and hospitality sector, whose job openings went from 1.199 million in May to 0.935 million in June, mostly due to a decline in job openings in the accommodation and food services sector. Another sector that showed a relatively large decline was the financial activities sector, whose job openings declined to 0.344 million in June compared to 0.490 million in May. The job opening rate declined to 4.4% in June compared to a rate of 4.6% in May. Hires also declined in June compared to May, at 5.204 million versus 5.465 million while the hires rate declined to 3.3% compared to 3.4% in May. Total separations were down in June, at 5.060 million compared to 5.213 million in May while the total separations rate declined to 3.2% compared to 3.3% in May. Job openings have trended sideways since early 2024 and have settled close to 7.4 million, on average, which is the level reported for June today.
2Q25 GDP: Real GDP was stronger than expected, up 3.0%, according to the first estimate released by the BEA. However, the domestic economy, which includes consumer spending and gross private fixed investment, increased by just 1.2% during the quarter after increasing by 1.9% during the first quarter. On the positive side, while the rush to beat tariffs helped push prices up during the first quarter, the opposite was true during the second quarter. The PCE price index increased by just 2.1% during the second quarter of the year after surging by 3.7% during the first quarter, while the core PCE price index was up by 2.5% in Q2 compared to an increase of 3.5% during the first quarter. This should be good news for the Federal Reserve (Fed) as it is scheduled to make its decision later today. Although the news is good, it is highly unlikely that the Fed is going to act on this information and lower interest rates. However, these numbers show an economy that has weakened considerably, as shown by real final sales to private domestic purchasers, which increased by just 1.2% after increasing by 1.9% during the first quarter of the year. Real GDP increased a more than expected 3.0% during the second quarter of the year, quarter-over-quarter, annualized, according to the Bureau of Economic Analysis. Personal consumption expenditures (PCE) increased by 1.4% during the quarter after it increased by 0.5% during the first quarter of the year. Consumption of goods increased by 2.2% after an increase of just 0.1% in the first quarter of the year. Services consumption increased by 1.1% after increasing by 0.6% during the first quarter. Gross private domestic investment plunged by 15.6% after surging by 23.8% during the first quarter of the year. Within gross private domestic investment, fixed investment increased by just 0.4% after increasing by 7.6% during the first quarter. Nonresidential investment slowed down to 1.9% after surging by 10.3% in Q1. Most of the slowdown was due to a decline of 10.3% in investment in structures. Investment in equipment increased by 4.8% after surging by 23.7% in Q1. Residential investment was down by 4.6% during the quarter. Both structures and residential investment were negative in Q1 and Q2. Exports of goods and services were down by 1.8% while imports of goods and services plunged by 30.3% after rising by 37.9% during Q1. Finally, government consumption expenditures and investment were up 0.4% after falling by 0.6% in Q1.Final sales to private domestic purchasers weakened further, increasing by 1.2% after increasing by 1.9% in Q1. In terms of contribution to GDP growth, PCE contributed 0.98 percentage points while gross private domestic investment subtracted 3.09 percentage points. The change in private inventories subtracted 3.17 percentage points after contributing 2.59 percentage points during the first quarter of the year. Net exports added a stunning 5.18 percentage points during the quarter after subtracting 4.66 percentage points during the first quarter. Finally, government consumption expenditures and gross investment added 0.08 percentage points to GDP growth, mostly from state and local governments. The price index for personal consumption expenditures was up by 2.1% during the second quarter after a 3.8% print during the first quarter of the year. Excluding food and energy prices, the core PCE price index was up by 2.5% during the quarter after an increase of 3.5% during the first quarter of the year. The strong recovery in real GDP was the consequence of the front-loading of imports during the first quarter of the year as firms purchased imports ahead of tariffs. However, the underlying strength of the US economy weakened during the quarter as real final sales to private domestic purchasers grew by 1.2% during the second quarter after increasing by 1.9% during the first quarter.
Personal Income: Personal income and expenditures were in line with expectations while price pressures were slightly higher than expected in June. Stronger price pressure in goods and weakening pricing pressures in the service side of consumption are clear indications that firms are having trouble passing higher prices to consumers with services prices weakening considerably compared to the recent past. The saving rate stayed at 4.5% in June but is down from a rate of 5.0% in April of this year. Today’s report is in line with yesterday's GDP release and shows a weakening consumer as the second quarter ended, which is in line with our view of a weakening US economy during the second quarter of the year. Personal income, disposable personal income and personal consumption expenditures (PCE), all increased as expected, up 0.3%, in June of this year, month-on-month, according to the Bureau of Economic Analysis. In May, personal income had declined by 0.4%, month-on-month, while disposable personal income was down by 0.5% and PCE had remained flat. Real disposable personal income was flat in June, month-on-month, while real personal consumption expenditures were up by just 0.1%, month-on-month. The headline PCE price index was up 0.3%, the same rate as the core PCE price index, month-on-month. On a year-earlier basis, the PCE price index was up to 2.6% while the core PCE price index was up 2.8%. Compensation of employees was up by 0.2% as the increase in wages and salaries was weak, up 0.1%, but supplements to wages and salaries was relatively strong, up 0.4%. Goods prices increased by a strong 0.4% in June after increasing by just 0.1% in both April and May. This followed a decline of 0.5% in March. Services prices increased by 0.2% for a fourth consecutive month in June, which also reflects weakness in the consumption of services and relative the inability of firms to pass along price increases. In real terms, personal consumption expenditures were weak, up just 0.1% in June after falling by 0.2% in May. Within goods consumption, real durable goods consumption declined for a third consecutive month in June, down by 0.5%. Furthermore, goods consumption has been down for 5 months out of 6 months this year, month-on-month. Real nondurable goods consumption was up 0.4% in June after falling by 0.3% in May. Weakness in the service sector has also been important during the first half of the year, as real services consumption was up just 0.1% for a third consecutive month in June.
Employment Cost Index: In the second quarter of 2025, compensation costs came in slightly below expectations on a quarter-over-quarter basis, largely due to softer benefits growth. However, wages and salaries rose at a slightly faster pace compared to Q1, and wage growth continued to outpace inflation, signaling a positive boost in household purchasing power during the period. Overall, compensation costs continued to slow down, which is good news for the Fed and should keep inflationary pressures under control. Compensation costs for civilian workers increased by 0.9% during the second quarter of the year, according to the US Bureau of Labor Statistics. This was the consequence of a 1.0% increase in wages and salaries and a 0.7% increase in benefit costs, according to the release. On a year-earlier basis, compensation costs for civilian workers increased by 3.6% during the second quarter of the year. Wages and salaries increased by 3.6% on a year-earlier basis. Benefit costs increased by 3.5% on a year-over-year basis. Compensation costs for private industry workers increased by 3.5% over the previous year. Compensation costs for state and local government workers increased by 4.0% year-over-year. The pace of QoQ growth of wages and salaries increased compared to 1Q25, but overall compensation remained nearly unchanged due to softer benefits.
Employment Report: This was a bad employment report considering that the downward revisions to each of the previous two months surpassed 100k, which would put today’s 73,000 increase in jobs in negative territory. Furthermore, many of the layoffs in the government sector have yet to be counted, and this could spell trouble for the US labor market. The employment weakness was broad based, with the health care and social assistance sector saving the day for July’s report. On net, there were 258,000 fewer jobs created in May and June than originally reported. If the FOMC members had access to this jobs report when they finished their monetary policy meeting, they should have reduced interest rates. Now, there is a chance that the Federal Reserve (Fed) may have to lower interest rates in an unscheduled meeting if the August employment report and the revisions to July show disappointing numbers like those we saw today. Nonfarm employment was much lower than expected in July, only up 73,000, while the rate of unemployment increased to 4.2% from 4.1% in June and was in line with expectations. There were also large downward revisions to May and June. The net revision to the May and June employment numbers was an impressive -258,000, that is -125,000 in May and -133,000 in June. The May employment number was lowered from an original print of 144,000 to just 19,000 while June’s employment creation number was revised down from 147,000 to just 14,000. In today’s report, total private employment increased by 83,000. The goods-producing sector saw jobs decline by 13,000, with the largest decline in manufacturing jobs, down 11,000. The private service-providing sector saw jobs increase by 96,000. Wholesale trade lost 7,800 jobs while retail trade saw jobs increase by 15,700. Transportation and warehousing added 3,600 jobs while the financial activities sector added another 15,000 during the month. The professional and business services sector saw jobs decline by 14,000, while the private education and health services sector saved the day, adding a strong 79,000, jobs most of them in the health care and social assistance areas, which accounted for 73,300 of those 79,000 jobs. Finally, government employment declined by 10,000.Average weekly hours increased slightly, to 34.3 in July from 34.2 in June, while average hourly earnings increased to $36.44 from $36.32 in June. Thus, average weekly earnings increased to $1,249.89 in July compared to $1,242.14 in June. The Household Survey showed employment declining by 260,000 during July, while the labor force participation rate declined from 62.3% in June to 62.2% in July. May’s downward revision to nonfarm employment was due to a decline of 50,000 in government employment, which was originally reported to have grown by 6,000. However, that does not explain all of the revisions, which means that private employment was also revised down considerably, from 140,000 to just 69,000 in May. Meanwhile, private employment was revised down to just 3,000 in June from an original print of 74,000.
ISM Manufacturing: The manufacturing sector continued to contract in July, with “79 percent of the sector’s gross domestic product (GDP) contracted in July, up from 46 percent in June.” None of the major manufacturing industries reported expansion compared to four that did so the previous month. The Employment Index in the sector also deteriorated, consistent with today’s Employment Report, which showed a loss of 11,000 manufacturing jobs. While the Prices Index eased slightly, it remains elevated, marking the tenth consecutive month of price increases. The Supplier Deliveries Index dropped by 4.9 points; however, this apparent improvement in supply chain performance likely reflects weakening demand rather than enhanced delivery efficiency. Survey respondents continued to cite uncertainty and tariffs as key challenges facing the sector. These developments support our broader view of a softening economic environment, but not one that signals an imminent recession. The ISM Manufacturing PMI came out below expectations, at 48.0 compared to a reading of 49.0 in June, according to the Institute for Supply Management. The New Orders Index was stronger in July, at 47.1 compared to 46.4 in June, while the Production Index was stronger and remained above the 50-demarcation point, at 51.4 compared to a reading of 50.3 in June. The Employment Index deteriorated further, to 43.4 compared to 45.0 in June. Supplier Deliveries fell into contraction territory as they weakened in July to 49.3 from 54.2 in June. The Inventories Index was down and remained below the demarcation point, at 48.9 compared to 49.2 in June. The Customers’ Inventories Index was down slightly and still contracting, at 45.7 compared to 46.7 in June. The Prices Index softened to 64.8 in July compared to a reading of 69.7 in June. The Backlog of Orders Index was stronger, at 46.8 compared to 44.3 in June. The New Export Orders Index and Imports Index were almost unchanged and remained in contraction, at 46.1 and 47.6, respectively. This was the fifth consecutive month in contraction for the ISM Manufacturing PMI. Once again, tariffs as well as uncertainty concerns were mentioned repeatedly by ISM Manufacturing survey respondents. The Institute for Supply Management indicates that an ISM Manufacturing PMI “above 42.3 percent, over a period of time, generally indicates an expansion of the overall economy.”
Construction Spending: Construction spending continued to decline in June, both in month-over-month terms as well as on a year-over-year basis. Although much of the decline was due to a very weak performance by residential construction spending, the recent weakness in nonresidential construction spending is raising concerns that high interest rates are starting to bite the nonresidential construction sector as the positive effects of the CHIPS and IRA acts continue to fade. As we argued last week in our weekly publication, the weakness in housing is upping the ante, but the weakness in nonresidential investment could signal trouble for the prospects of the US economy in the second half of the year. Total construction spending was down by 0.4% in June after declining by the same rate in May, according to the US Census Bureau. FactSet expectations were for a small, 0.1% increase during the month. On a year-over- year basis, total construction spending was down 2.9%. Total residential construction spending was down a larger 0.7% in June and by 6.0% compared to June of last year. Total nonresidential construction spending was down by 0.1% in June, month-on-month, and down by 0.5% compared to the previous year. Private construction spending was down by 0.5%, month-on-month, and down by 5.2% compared to a year ago, with private residential construction spending down 0.7%, month-on-month, and down by 6.2% on a year-ago basis. New single-family construction spending was down 1.8%, month-on-month, and also down by 5.3% on a year-over-year basis, while new multifamily construction spending was flat in June, month-on-month, but down by 9.5% on a year-over-year basis. The smaller, public construction sector was up by 0.1%, month-on-month, and by 5.2% compared to a year earlier. Within public construction, residential construction spending, which is a very small sector within public construction spending, declined by 1.0%, month-on-month, but was up 8.4% compared to a year earlier. Nonresidential public construction spending was up slightly, 0.1%, month-on-month, and also up, by 5.1%, on a year-earlier basis. The strength of the nonresidential construction spending sector has been one of the most important factors keeping nonresidential investment spending in positive territory over the last several years. Today, the sector is starting to weaken, which is not good for the overall economy.
Economic and market conditions are subject to change.
Opinions are those of Investment Strategy and not necessarily those of Raymond James and are subject to change without notice. The information has been obtained from sources considered to be reliable, but we do not guarantee that the foregoing material is accurate or complete. There is no assurance any of the trends mentioned will continue or forecasts will occur. Past performance may not be indicative of future results.
Consumer Price Index is a measure of inflation compiled by the US Bureau of Labor Statistics. Currencies investing is generally considered speculative because of the significant potential for investment loss. Their markets are likely to be volatile and there may be sharp price fluctuations even during periods when prices overall are rising.
Consumer Sentiment is a consumer confidence index published monthly by the University of Michigan. The index is normalized to have a value of 100 in the first quarter of 1966. Each month at least 500 telephone interviews are conducted of a contiguous United States sample.
Personal Consumption Expenditures Price Index (PCE): The PCE is a measure of the prices that people living in the United States, or those buying on their behalf, pay for goods and services. The change in the PCE price index is known for capturing inflation (or deflation) across a wide range of consumer expenses and reflecting changes in consumer behavior.
The Consumer Confidence Index (CCI) is a survey, administered by The Conference Board, that measures how optimistic or pessimistic consumers are regarding their expected financial situation. A value above 100 signals a boost in the consumers’ confidence towards the future economic situation, as a consequence of which they are less prone to save, and more inclined to consume. The opposite applies to values under 100.
Certified Financial Planner Board of Standards Center for Financial Planning, Inc. owns and licenses the certification marks CFP®, CERTIFIED FINANCIAL PLANNER®, and CFP® (with plaque design) in the United States to Certified Financial Planner Board of Standards, Inc., which authorizes individuals who successfully complete the organization’s initial and ongoing certification requirements to use the certification marks.
Links are being provided for information purposes only. Raymond James is not affiliated with and does not endorse, authorize or sponsor any of the listed websites or their respective sponsors. Raymond James is not responsible for the content of any website or the collection or use of information regarding any website's users and/or members.
GDP Price Index: A measure of inflation in the prices of goods and services produced in the United States. The gross domestic product price index includes the prices of U.S. goods and services exported to other countries. The prices that Americans pay for imports aren't part of this index.
Employment cost Index: The Employment Cost Index (ECI) measures the change in the hourly labor cost to employers over time. The ECI uses a fixed “basket” of labor to produce a pure cost change, free from the effects of workers moving between occupations and industries and includes both the cost of wages and salaries and the cost of benefits.
US Dollar Index: The US Dollar Index is an index of the value of the United States dollar relative to a basket of foreign currencies, often referred to as a basket of U.S. trade partners' currencies. The Index goes up when the U.S. dollar gains "strength" when compared to other currencies.
The FHFA HPI is a broad measure of the movement of single-family house prices. The FHFA HPI is a weighted, repeat- sales index, meaning that it measures average price changes in repeat sales or refinancings on the same properties.
Import Price Index: The import price index measure price changes in goods or services purchased from abroad by U.S. residents (imports) and sold to foreign buyers (exports). The indexes are updated once a month by the Bureau of Labor Statistics (BLS) International Price Program (IPP).
ISM Services PMI Index: The Institute of Supply Management (ISM) Non-Manufacturing Purchasing Managers' Index (PMI) (also known as the ISM Services PMI) report on Business, a composite index is calculated as an indicator of the overall economic condition for the non-manufacturing sector.
The ISM Manufacturing Index: The GDP Now Institute of Supply Management (ISM) Manufacturing Measures the health of the manufacturing sector by surveying purchasing managers at manufacturing firms. The survey asks about current business conditions and expectations for the future, including new orders, inventories, employment, and deliveries.
Consumer Price Index (CPI) A consumer price index is a price index, the price of a weighted average market basket of consumer goods and services purchased by households.
Producer Price Index: A producer price index (PPI) is a price index that measures the average changes in prices received by domestic producers for their output.
Industrial production: Industrial production is a measure of output of the industrial sector of the economy. The industrial sector includes manufacturing, mining, and utilities. Although these sectors contribute only a small portion of gross domestic product, they are highly sensitive to interest rates and consumer demand.
The NAHB/Wells Fargo Housing Opportunity Index (HOI) for a given area is defined as the share of homes sold in that area that would have been affordable to a family earning the local median income, based on standard mortgage underwriting criteria.
Conference Board Coincident Economic Index: The Composite Index of Coincident Indicators is an index published by the Conference Board that provides a broad-based measurement of current economic conditions, helping economists, investors, and public policymakers to determine which phase of the business cycle the economy is currently experiencing.
Conference Board Lagging Economic Index: The Composite Index of Lagging Indicators is an index published monthly by the Conference Board, used to confirm and assess the direction of the economy's movements over recent months.
New Export Index: The PMI New export orders index allows us to track international demand for a country's goods and services on a timely, monthly, basis.
Gold is subject to the special risks associated with investing in precious metals, including but not limited to: price may be subject to wide fluctuation; the market is relatively limited; the sources are concentrated in countries that have the potential for instability; and the market is unregulated.
The Conference Board Leading Economic Index: Intended to forecast future economic activity, it is calculated from the values of ten key variables.
Source: FactSet, data as of 7/25/2025